

Have you ever witnessed a promising uptrend reverse on you and be left wondering what warning signs you missed? The double top pattern may have been trying to tell you something. This powerful chart formation has assisted traders for decades to identify major trend reversals and protect their capital.
What is a Double Top Pattern?

A double top pattern is a bearish reversal pattern which occurs at the end of an uptrend and resembles the letter ‘M’ on a price chart. The pattern has two successive peaks, which are roughly of the same height, with a small dip in between.
This formation indicates that the buyers have tried to push the price above a certain resistance level twice, and failed to do so. This failure implies that the buying momentum is waning and selling pressure is slowly beginning to take over, which could result in a trend reversal.
The double top is complete when the price breaks the support level (the neckline) between the two peaks to the downside, confirming the bearish outlook.
How to Identify a Double Top Pattern?
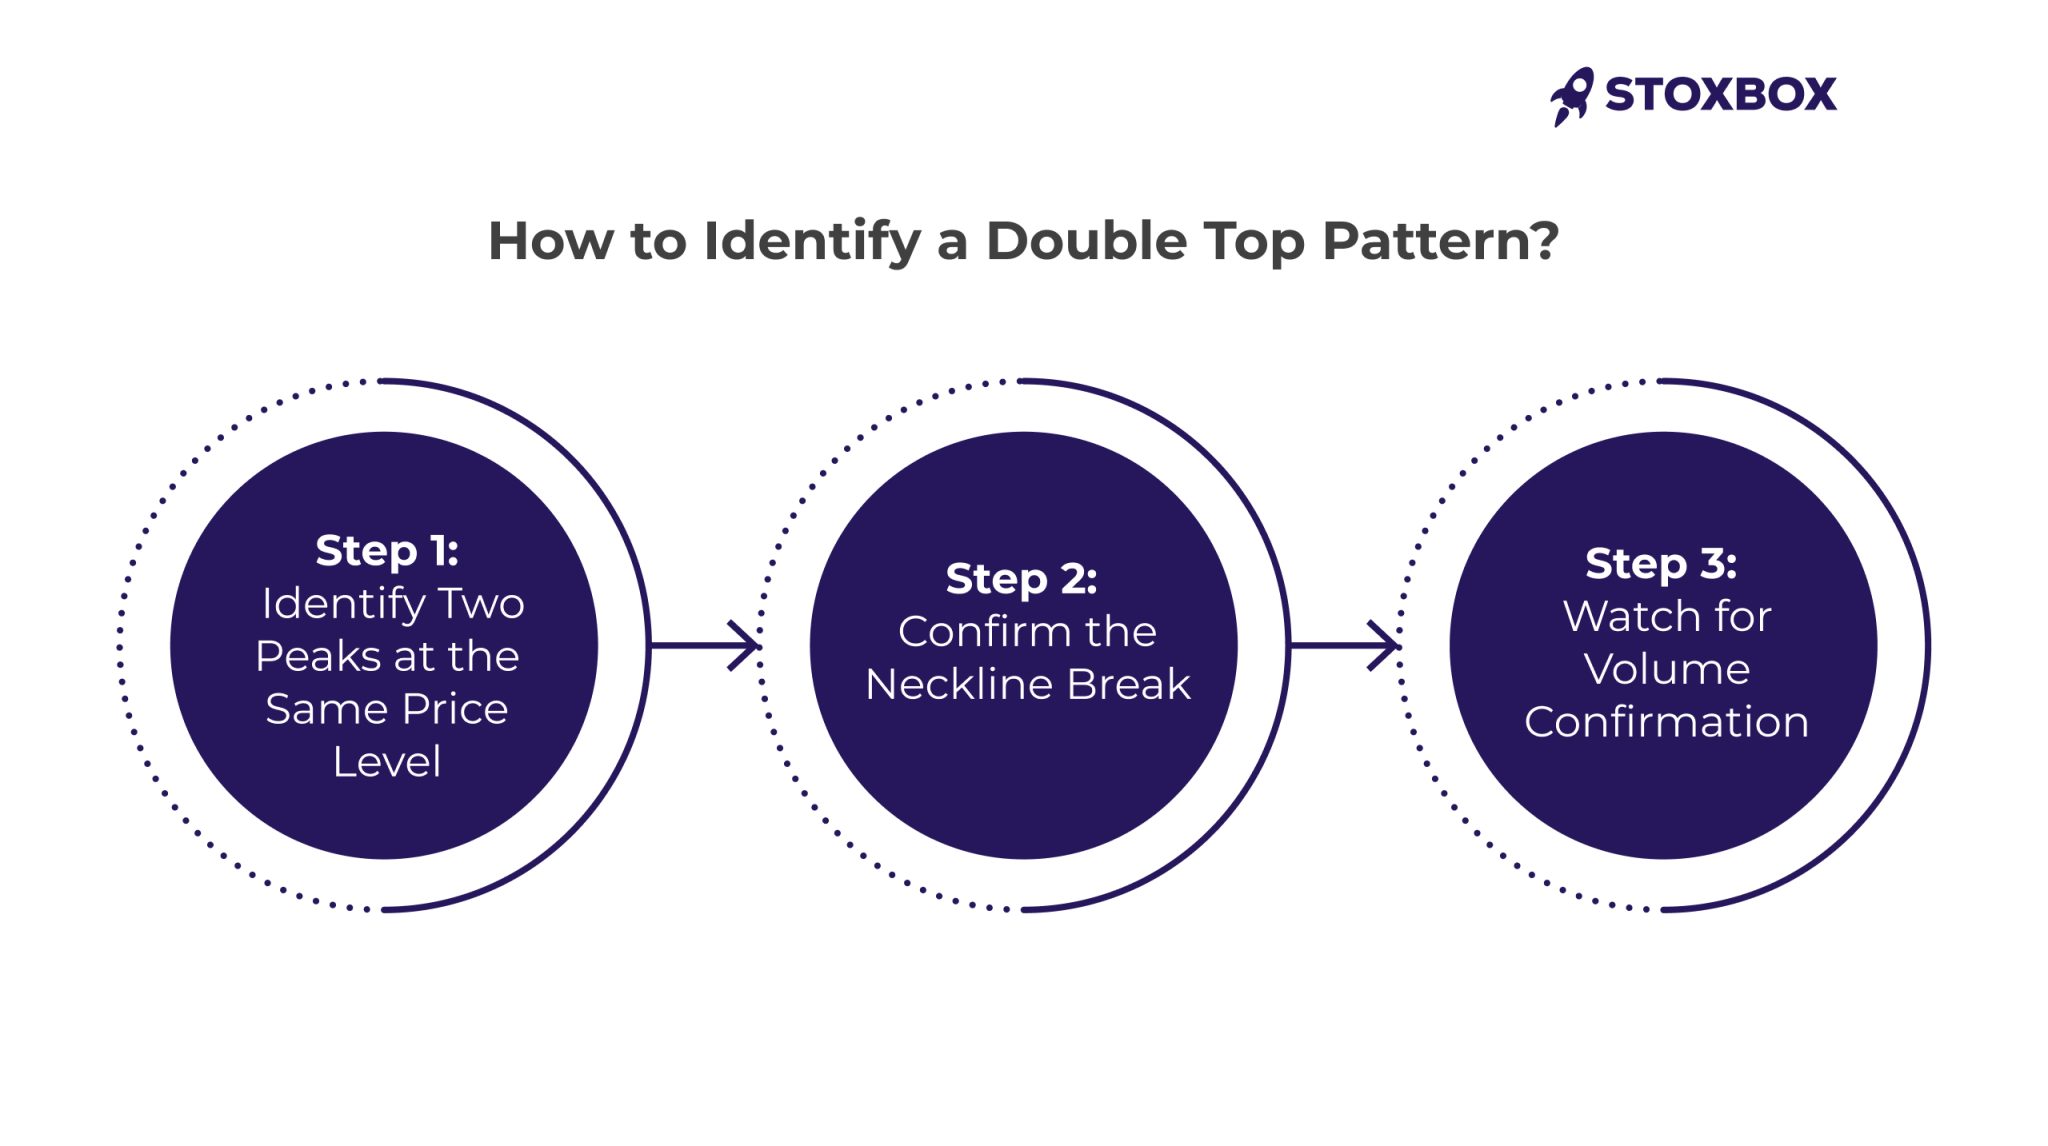
To identify a genuine double top pattern, one must pay attention to certain criteria:
Step 1: Identify Two Peaks at the Same Price Level
For two distinct peaks to be identified they must:
- Be within 3% of each other in terms of price
- Come after a considerable uptrend
- Be spaced out by a discernible valley which is usually 10-20% lower than the peaks.
Step 2: Confirm the Neckline Break
The “neckline” is the support level connecting the low point between the two peaks:
- Draw a horizontal line from the lowest point between the two peaks.
- Wait for the price to break below this neckline after the second peak forms.
- Confirm that the breaking candle closes decisively below the neckline.
Step 3: Watch for Volume Confirmation
Volume is the essential validator:
- First peak: Typically forms on high volume.
- Second peak: Often shows lower volume than the first peak.
- Neckline break: Should demonstrate a noticeable increase in volume.
What Does a Double Top Pattern Indicate?
The double top pattern reveals important psychological shifts:
- Sentiment Shift: Buyers attempt to break through resistance twice but fail to do so.
- Power Transfer: Selling pressure takes over from buying pressure.
- Psychological Factors: From optimism to doubt and then to capitulation by the traders.
How to Trade the Double Top Pattern
Converting pattern recognition into profitable trades requires a systematic approach:
Entry Point Strategy
- Conservative Entry: Open a short position once the price breaks and closes below the neckline.
- Aggressive Entry: Enter as the price approaches the neckline after forming the second peak.
- Retest Entry: Pullback to the neckline after the initial break.
Setting Stop-Loss Orders
Protect your capital with strategically placed stop-loss orders:
- Conservative Stop: Place stop-loss orders slightly above the second peak.
- Moderate Stop: Stops should be placed at the second peak and the neckline.
- Aggressive Stop: Stops are set just above the neckline.
Target Price Prediction
- Measure the height: Calculate the vertical distance from the peaks to the neckline.
- Project downward: Subtract this height from the neckline breakout point.
- Set multiple targets: Consider taking partial profits at 50%, 100%, and 150% of the pattern height
Double Top Pattern Example with Chart Analysis
- Preceding Uptrend: XYZ stock moved up from ₹250 to ₹380 in three months.
- First Peak: On January 15th, the stock reached ₹380 with above average volume.
- Valley Formation: Price dropped to ₹340 (the neckline) with decreasing volume.
- Second Peak: On February 20th, the stock reached ₹378 with lower volume than the first peak.
- Confirmation: On March 5, the price broke below the ₹340 neckline with increased volume
- Trade Execution:
- Entry: Short position at ₹335 (after neckline break)
- The stop-loss order was established at ₹385 which was above the second peak.
- The target price stood at ₹300 since the measured move between ₹380 and ₹340 equalled ₹40 which made ₹340 – ₹40 = ₹300.
- Outcome: The price reached the target on March 28 resulting in a profit of 10.4%
Example:
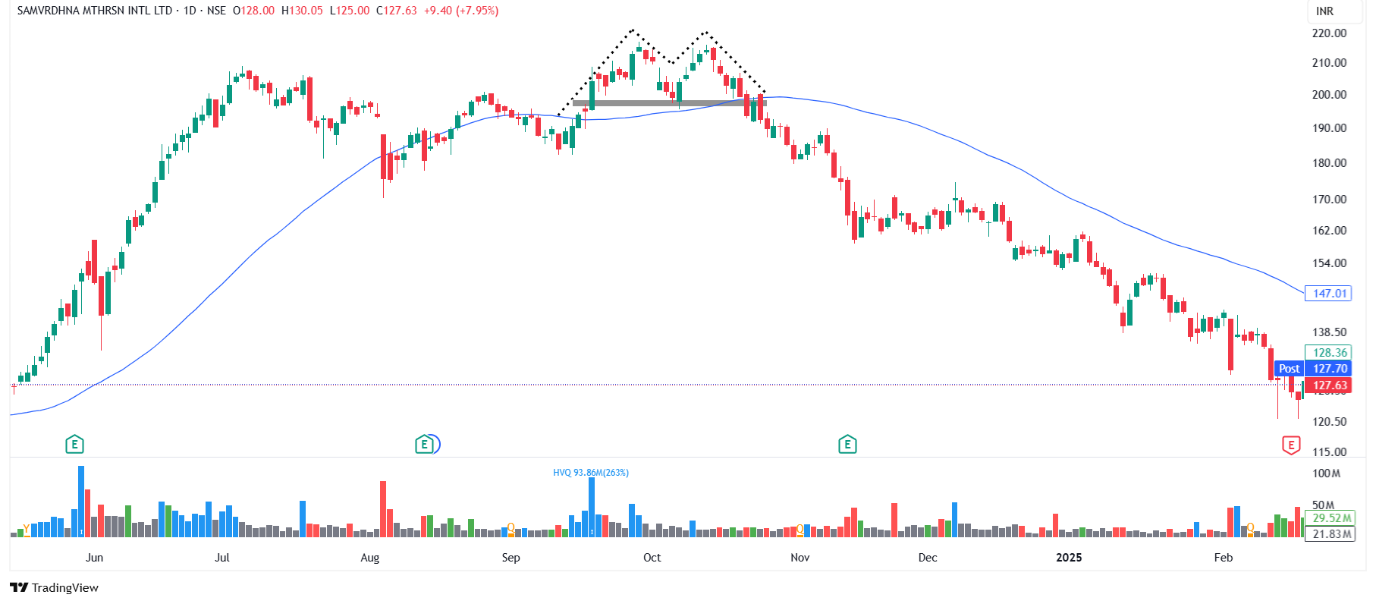
Chart Analysis: Samvardhana Motherson Intl. Ltd – Double Top (2024)
Preceding Uptrend: The stock surged from around ₹128 in July 2024 to a peak of ₹216 by September 2024, indicating a strong upward trend.
First Peak: On September 27, the stock hit ₹217 with heavy volume, suggesting strong buyer interest at the time.
Valley Formation: By October 8, the price fell to around ₹197, forming a neckline. Volume also declined during this phase, indicating reduced momentum.
Second Peak: The stock made a second attempt to rise, hitting ₹215 on October 14, but this time with lower volume, showing weakening bullish strength.
Confirmation: On October 24, the price broke below the neckline of ₹197 with increased volume, confirming the double top pattern.
Trade Execution:
- Entry: Short position at ₹197 after neckline breakdown
- Stop-Loss: ₹214 (above the second peak)
- Target: ₹197 – ₹159 = ₹37
Outcome:
The stock dropped to the target level of ₹159 by November 21, delivering a successful trade with a profit of 19%.
Common Mistakes to Avoid
Both beginner and advanced traders make mistakes throughout their careers:
- Clear Uptrend Required: Double tops must occur after a clear uptrend, followed by pattern formation and neckline confirmation before making an entry.
- Wait for Neckline Break: Traders must wait for the decisive neckline break before entering a position.
- Volume Patterns Matter: Volume patterns should be analyzed alongside price movements during trading analysis to ensure the pattern is valid.
- Comprehensive Market Analysis: Pattern trading should be used in conjunction with a complete market analysis across multiple timeframes.
Double Top vs. Head and Shoulders Chart Patterns
| Characteristic | Double Top | Head and Shoulders |
|---|---|---|
| Visual Shape | Two equal peaks | Three peaks (middle highest) |
| Complexity | Simpler structure | More complex formation |
| Formation Time | Usually forms faster | Typically takes longer |
The Double Top pattern is one of the most commonly used technical analysis tools for anticipating bearish reversals, but how does it stand compared to other patterns such as Head and Shoulders? Let’s demystify it:
Visual Shape
- Double Top: It is an “M” shape with two peaks approximately at the same level, which indicates that the price has been unable to breach through resistance.
- Head and Shoulders: This pattern creates a “head” between two “shoulders”, and the middle peak (the head) is the highest. It’s a three-peak formation that indicates a reversal of trend.
Complexity
- Double Top: The Double Top is a less complex structure – two peaks and a breakdown. It’s quicker to trade and easier to spot.
- Head and shoulders: This one is trickier. It features three distinct peaks – a well-formed left shoulder, a prominent head & a matching right shoulder. The formation typically takes longer to emerge & confirming it requires careful attention to symmetry and neckline structure.
Formation Time
- Double Top: Double Top forms quicker usually – the price touches the resistance twice and then begins to reverse.
- Head and Shoulders: Head and Shoulders takes longer to form sometimes even weeks or months since it occurs in three stages (left shoulder, head, right shoulder).
Double Top vs. Double Bottom
| Characteristic | Double Top | Double Bottom |
|---|---|---|
| Visual Shape | M" pattern | W" pattern |
| Market Position | Forms after uptrend | Forms after downtrend |
| Signal Type | Bearish reversal | Bullish reversal |
| Confirmation | Price breaks below neckline | Price breaks above neckline |
The Double Top and Double Bottom are classic reversal patterns used in technical analysis. Though they mirror each other in form, they signal completely opposite market behaviors. Let’s break them down:
Visual Shape
- Double Top: This pattern forms an “M” shape with two peaks at roughly the same level. It reflects failed attempts to push the price higher, indicating strong resistance.
- Double Bottom: This forms a “W” shape with two troughs at similar levels. It shows that selling pressure is weakening as the price fails to break lower twice.
Market Position
- Double Top: Appears after a sustained uptrend. It acts as a warning that buyers may be losing control and a reversal could follow.
- Double Bottom: Occurs after a prolonged downtrend. It suggests sellers are exhausted and buyers may be regaining strength.
Signal Type
- Double Top: Indicates a bearish reversal—traders often anticipate a decline once the Pattern confirms
- Double Bottom: Suggests a bullish reversal—the price typically rallies after the breakout.
Confirmation
- Double Top: The pattern is confirmed when the price breaks below the neckline (the support line between the troughs). This signals that sellers have taken over.
- Double Bottom: Confirmation happens when the price breaks above the neckline (resistance between the peaks). This signals that buyers are stepping in.
Frequently Asked Questions
1. What duration offers the best opportunities to identify double top patterns?
The reliability of double top patterns increases when using longer timeframes but they remain valid across all timeframes. Daily and weekly charts generate more dependable signals than hourly and minute charts.
2. Is the double top pattern always a bearish sign?
The double top pattern indicates bearish conditions only after a complete breakdown of the neckline with volume support.
3. Does the double top pattern ever prove ineffective?
Yes, double top patterns can fail even after apparent confirmation. The most common failure scenario occurs when prices briefly break below the neckline but quickly reverse.
4. What confirms a valid double top?
A double top pattern requires three essential conditions for validation: the price breaks through the neckline, volume increases at the breakout point, first peak volume surpasses second peak volume and both peaks achieve equal price points.