What are candlesticks exactly?
In the 1700s, a Japanese rice trader named Homma drew candlesticks to represent the price movement of rice on that particular day. Eventually, this was represented to depict the movement of stocks. 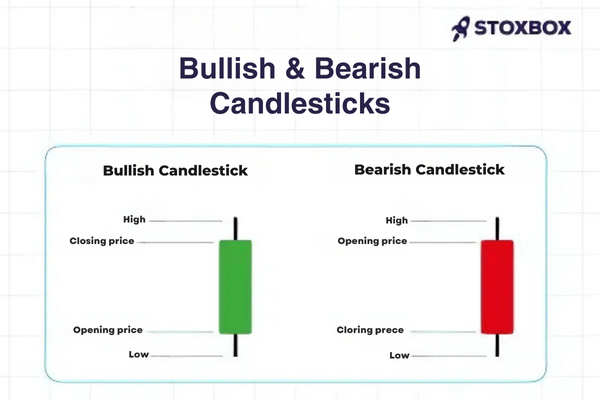
Bullish Candlestick Patterns
Bullish candlestick patterns suggest the possibility of an upcoming upward trend in the market, signaling that buyers are gaining control and potentially driving prices higher. Here are some notable bullish patterns:
1. Hammer
A hammer forms at the end of a downtrend and indicates a potential bullish reversal. It features a small body and a long lower wick, showing that even though there was strong selling pressure initially, buyers stepped in and pushed the price back up.
2. Bullish Engulfing
This two-candle pattern involves a small bearish candle followed by a larger bullish candle that completely engulfs the previous one. It suggests that after a period of selling, buyers have taken control, pushing the price significantly higher.
3. Morning Star
The morning star is a three-candle pattern that signals the end of a bearish trend. It starts with a long bearish candle, followed by a small bullish or bearish candle, and ends with a larger bullish candle. This pattern suggests that a reversal is likely, with buyers gaining momentum.
4. Piercing Pattern
This pattern appears after a downtrend and signals a reversal. It consists of a bearish candle followed by a bullish candle that opens lower but closes above the midpoint of the previous bearish candle, demonstrating strong buying pressure.
5. Three White Soldiers
This pattern involves three consecutive long bullish candles with short wicks, indicating sustained buying pressure. Each candle opens within the body of the previous one and closes near its high, signaling strong upward momentum.
6. Inverted Hammer
The inverted hammer appears at the bottom of a downtrend and signals a potential reversal. It has a small body and a long upper wick, showing that while buyers pushed the price higher, they couldn’t maintain full control. If confirmed by a subsequent bullish candle, it suggests a shift in momentum.
7. Bullish Harami
A bullish harami consists of a small bullish candle that forms within the body of a previous bearish candle. This two-candle pattern indicates that selling pressure is weakening, and buyers may be starting to gain control, suggesting a potential reversal.
Bearish Candlestick Patterns
Bearish candlestick patterns signal that sellers are taking control of the market, potentially leading to a downward price movement. Some key bearish patterns include:
1. Hanging Man
Similar in appearance to the hammer, the hanging man forms at the end of an uptrend and signals a possible reversal. Its small body and long lower wick indicate strong selling pressure, suggesting that bulls may be losing control.
2. Bearish Harami
This two-candle pattern consists of a large bullish candle followed by a small bearish candle that fits within the body of the first one. It appears at the top of an uptrend and signals a weakening in buying pressure, indicating a possible bearish reversal.
3. Bearish Evening Star
The evening star is a three-candle pattern that marks the end of an uptrend. It begins with a long bullish candle, followed by a short bullish or bearish candle, and concludes with a long bearish candle. This pattern suggests that the bullish momentum is weakening, and sellers are starting to dominate.
4. Dark Cloud Cover
This bearish reversal pattern consists of a bullish candle followed by a bearish candle that opens higher but closes below the midpoint of the previous bullish candle. It indicates that sellers have taken over, and a downward movement is likely.
5. Gravestone Doji
A gravestone doji forms when the open, close, and low prices are almost identical, creating a long upper wick. Typically appearing at the top of an uptrend, this pattern signals that buyers attempted to push the price higher but lost control, indicating a potential reversal.
6. Three Black Crows
This pattern consists of three consecutive long bearish candles, each closing lower than the previous one. Forming after an uptrend, it suggests strong selling pressure and often signals the beginning of a sustained downward trend.
By understanding these bullish and bearish patterns, traders can better assess market conditions and make informed decisions about entering or exiting positions.
How to Use Bullish and Bearish Candlestick Patterns in Trading
Bullish and bearish candlestick patterns are powerful tools that traders use to spot potential market reversals, trends, and shifts in momentum. These patterns help traders make more informed decisions about when to enter or exit a trade. Here’s how you can effectively incorporate them into your trading strategy:
1. Combine with Other Technical Indicators
Candlestick patterns offer valuable insights, but they are more accurate when paired with other technical indicators. Common tools include moving averages, the Relative Strength Index (RSI), and volume. For example:
- A bullish engulfing pattern alongside an RSI reading below 30 (indicating oversold conditions) could signal a strong buying opportunity.
- A bearish engulfing pattern combined with high volume and an RSI above 70 (indicating overbought conditions) might suggest it’s time to sell.
Why it’s important: Relying solely on candlestick patterns can sometimes lead to false signals. Using multiple indicators increases the reliability of your trades and helps confirm the strength of the pattern.
2. Analyze the Overall Trend
Candlestick patterns are most effective when interpreted in the context of a broader trend. Before acting on any bullish or bearish signals, it’s essential to determine if the pattern aligns with the larger market movement:
- Bullish patterns are more credible when they appear in a downtrend, signaling a potential reversal.
- Bearish patterns are stronger in an uptrend, indicating a possible shift in momentum.
Why it’s important: Trading against the trend is risky. Understanding the overall market direction ensures that your trades align with the broader sentiment, improving your chances of success.
3. Time Frames Matter
Candlestick patterns can appear across various time frames, such as daily, weekly, or hourly charts. Longer time frames, like daily or weekly, tend to provide more reliable signals than shorter time frames like 5-minute or 15-minute charts. However, for day traders, shorter time frames are key for capturing quick market movements.
Why it’s important: The choice of time frame should match your trading style. Longer time frames reduce the chance of false signals, while shorter ones offer faster trading opportunities but come with higher risk.
4. Use Risk Management Strategies
While candlestick patterns can predict price movements, no trade is guaranteed to succeed. To manage risk effectively:
- Set stop-loss orders below support levels in bullish patterns or above resistance levels in bearish patterns to protect yourself if the market moves against you.
- Adjust position sizing according to your risk tolerance to avoid risking too much on a single trade.
Why it’s important: Proper risk management ensures that no single trade can cause significant financial damage. Even the most promising candlestick patterns can fail, so it’s crucial to have safeguards in place.
5. Wait for Confirmation
It’s essential to wait for confirmation before making a trade based on a candlestick pattern. For example:
- In a bullish pattern, wait until the price closes above the high of the bullish candle.
- In a bearish pattern, wait until the price closes below the low of the bearish candle.
Why it’s important: Waiting for confirmation reduces the risk of jumping into a trade too early. It helps ensure that the pattern is valid and aligns with the overall market trend, minimizing the likelihood of acting on a false signal.

Double Top Pattern: The Ultimate Trading Guide
Have you ever witnessed a promising uptrend reverse on you...