Candlestick charts are a popular tool that traders use to figure out how the market is moving. For example, if a trader sees a ‘hammer candlestick‘ at the end of a downtrend, they might decide it’s a good time to buy because it could mean the price is about to go up. If you’ve ever wondered how traders predict if prices will go up or down, candlestick charts are one of the main ways they do it. These charts show price changes over time, which makes it easier for traders to understand what is happening in the market.
Table of Contents
Candlestick charts were first created by Japanese rice traders in the 1700s. Munehisa Homma, who is often called the inventor of these charts, used them to understand price changes and the emotions behind trading decisions. Today, traders use candlestick charts for all kinds of trading, like stocks, forex, cryptocurrencies, and commodities, because they are reliable and easy to use.
Each candlestick shows whether the price went up or down, and traders look for special patterns to figure out what might happen next. Patterns like the hammer candlestick and the inverted hammer are important because they can show a possible price increase. The hammer candlestick pattern, for example, means that there was strong buying after a price drop, which could lead to a bullish (upward) trend. On the other hand, the shooting star candlestick is a bearish (downward) pattern that shows a possible price drop after a price rise. Learning to recognize these candlestick chart patterns helps traders make better predictions.
Candlestick charts come in different styles, and many traders use guides, like PDFs on candlestick chart patterns, to help them understand what they see. These guides usually explain common patterns, have pictures to show what they look like, and give tips on how to spot them during live trading. You can find these guides on trusted websites like Investopedia or TradingView. Bullish candlestick patterns, like the hammer, are useful for traders who want to buy during an upward trend. Knowing how to read candlestick chart patterns can make your trading strategy stronger and give you a better idea of where the market might be heading.
Each candlestick tells a story about price changes whether it was a day of gains or losses. Traders can quickly see trends, like bullish trends where buyers are in control or bearish trends where sellers are pushing the price down. Candlestick charts give an easy-to-understand picture of how investors are feeling, which helps traders guess what might happen next and make better choices.
If you’re just starting, don’t worry candlestick charts might look a bit tricky, but with Stoxbox, they get much easier to understand. At Stoxbox, we make hard trading ideas simple and easy to learn. Once you know what each part of the candlestick means and how they fit together, you’ll feel better about reading market trends. With practice and Stoxbox’s help, you can find important candlestick patterns that will help you make better trading choices and guess what might happen next in the market.
Breaking Down Candlestick Components
Candlestick charts are made up of different parts that help traders understand how the market is moving. Let’s break down each part of a candlestick and see what it means.
The Body, Wick, and Shadow
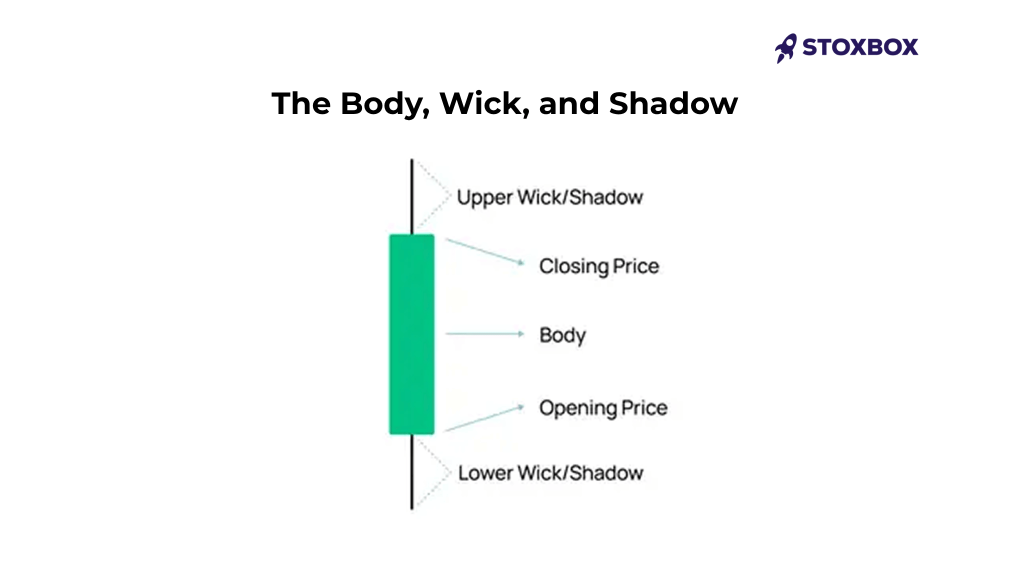
- The Body: The body of a candlestick shows the opening and closing prices during a specific time. A long body means there was a big price change, while a short body means there wasn’t much change. For example, a hammer candlestick has a small body and a long lower wick, which often means that the price might start going up again. The hammer candlestick pattern is great for spotting buying opportunities when prices have been falling.
- The Wick (Shadow): The wick, also called the shadow, shows the highest and lowest prices reached during the time period. A long wick on top of a shooting star candle can mean that buyers tried to push the price up, but sellers took control, causing the price to drop. The wick gives important clues about the battle between buyers and sellers.
- The Shadow: Sometimes, the wick is called the shadow. Shadows on both sides of the body, like in a doji candle, mean that the market is undecided, with neither buyers nor sellers in control. Different shadows, like those in a dragonfly doji or gravestone doji, can help traders predict where the market might go next.
Candlestick Timeframes
Candlestick charts can show different timeframes, such as 1-minute, daily, or weekly intervals. The timeframe affects how much information each candle chart pattern has:
- 1-Minute Candlestick: Good for day traders who need to make quick decisions based on small price changes.
- Daily Candlestick: Helps swing traders see major bullish or bearish trends over a longer time.
- Weekly Candlestick: Useful for long-term investors who want to see the bigger picture of the market.
For example, an inverted hammer candlestick on a 1-minute chart might not be very important, but if the same pattern appears on a daily chart, it could mean a big change is coming. The morning star pattern is another example of a trend reversal that traders look for, especially on daily or weekly charts, to predict future market moves.
Understanding Different Candlestick Patterns
- Bullish Candlestick Patterns: Patterns like the morning star candlestick pattern, bullish engulfing pattern, and hammer candle help traders find opportunities where prices might rise. The bullish engulfing pattern is important because it shows that buyers are becoming stronger than sellers.
- Bearish Candlestick Patterns: Patterns like the bearish engulfing pattern, evening star pattern, and hanging man pattern help traders know when a trend might reverse downwards. A hanging man candle shows that even though the price went up during the day, sellers took control by the end, which might mean a bearish move is coming.
Using Candlestick Components in Different Markets
The way these candlestick chart patterns are understood can change depending on the market. In Forex, for example, patterns like the doji candlestick pattern and marubozu candle can signal major changes because of the high liquidity. In Crypto, patterns like the shooting star candlestick and bullish engulfing are used more carefully because cryptocurrencies can be very volatile.
Knowing the basic parts of a candlestick, like the body, wick, and shadow, helps traders understand price changes. Recognizing different patterns like the inverted hammer, doji candlestick, or bullish engulfing pattern helps traders make better decisions. Knowing how to use these patterns in different timeframes and markets, like Forex and Crypto, can really improve trading skills.
Whether you are looking at a morning star pattern or a hanging man candlestick, learning about these candlestick components can give you a big advantage in trading. With practice, you will be able to spot bullish candlestick or bearish candle patterns and understand how they fit into the bigger picture of the market, which will help you predict changes and make better trading choices.
Types of Candlestick Patterns Explained
Understanding candlestick patterns is important for anyone who wants to learn about trading. These patterns help traders figure out where the market might go next, which helps them make better choices. Let’s take a look at some of the most important trading candlestick patterns and how they can help you understand market trends.
Bullish Candlestick Patterns
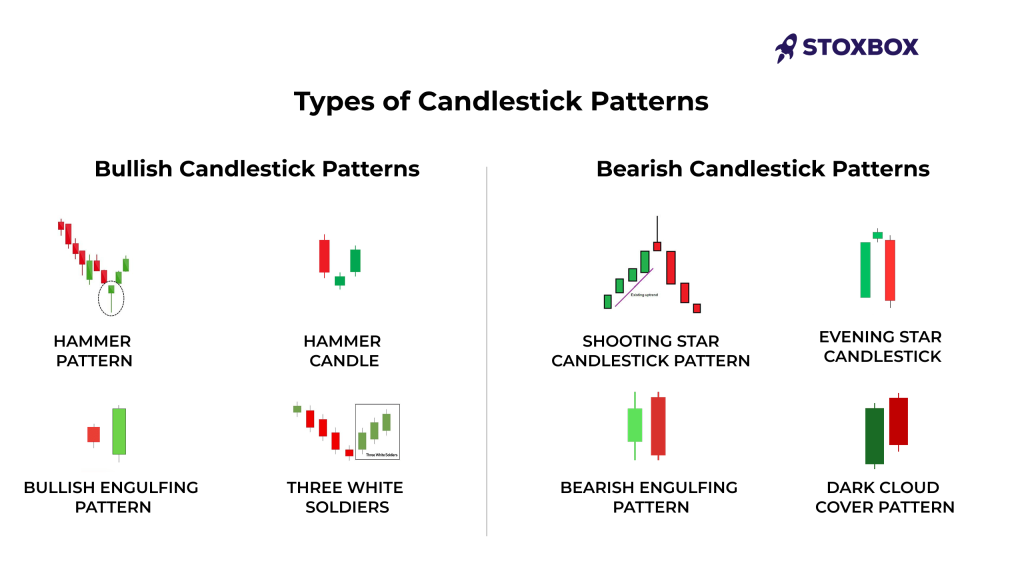
- Hammer Pattern: The hammer pattern is a strong sign that the market might go up. The bullish hammer or bullish hammer candlestick has a small body and a long lower wick. This means that even though sellers tried to push the price down, buyers stepped in and pushed it back up. This often happens after a downtrend and shows that the price could start going up again. The red hammer candlestick can also be a sign of a reversal, but it needs more confirmation from the next candle.
- Morning Star Candle: The morning star candle pattern shows up after a downtrend. It has three parts: first, a bearish candle, then a small candle that shows indecision (like a dragonfly doji candlestick), and finally a strong bullish candle. This pattern means that the sellers are losing strength, and buyers are starting to take control, which could lead to an upward trend.
- Bullish Engulfing Pattern: The bullish engulfing pattern happens when a small bearish candle is followed by a larger bullish candle that completely covers it. This shows that buyers have taken over from sellers. It’s useful in the stock market candlestick analysis to spot when a downtrend might be reversing.
- Three White Soldiers: The three white soldiers pattern has three long bullish candles in a row. Each one opens within the body of the previous candle and closes higher. This pattern is a strong sign that the market is likely to keep going up, showing that buyers are getting stronger.
Bearish Candlestick Patterns
- Shooting Star Candlestick Pattern: The shooting star candlestick pattern shows up after an uptrend. It has a small body at the bottom and a long upper wick. This means that buyers tried to push the price up, but sellers took over, which could mean the price will drop. It looks like a star falling from the sky, which is why it’s called a shooting star.
- Evening Star Candlestick: The evening star candlestick is the opposite of the morning star pattern. It has three parts: a bullish candle, a small indecisive candle, and then a large bearish candle. This pattern means that the buying trend is losing strength and a downward reversal could be coming.
- Bearish Engulfing Pattern: The bearish engulfing pattern is when a small bullish candle is completely covered by a larger bearish candle. This shows that sellers are taking control from buyers, which could lead to a price drop. It’s a useful pattern for traders to manage risk and prepare for market downturns.
- Dark Cloud Cover Pattern: The dark cloud cover pattern is a bearish signal that happens after an uptrend. The first candle is bullish, but the second candle opens higher and then closes below the middle of the first candle, which means sellers are getting stronger.
Other Important Patterns
- Piercing Pattern: The piercing pattern is a bullish signal that happens after a downtrend. It has a bearish candle followed by a bullish candle that closes more than halfway into the bearish candle, showing that buyers are taking over.
- Marubozu Candle: A marubozu candle has no wicks, which means the price opened or closed at the highest or lowest point of the session. A bullish marubozu means strong buying pressure, while a bearish marubozu means strong selling pressure.
- Inverted Hammer Candlestick Pattern: The inverted hammer candlestick pattern has a small body with a long upper wick and little or no lower wick. It usually shows up after a downtrend and signals that buyers are trying to push the price up, which could lead to a reversal.
- Bearish Harami: The bearish harami pattern happens when a large bullish candle is followed by a smaller bearish candle that stays within the previous candle’s body. This shows that the upward trend is slowing down and a reversal could be near.
Applying Patterns Across Markets
These candle chart patterns are used in many markets, including Forex, Crypto, and the share market. Knowing which trading candle patterns are reliable in different markets is important for traders. For example, the bullish hammer pattern might work better in a less volatile market like Forex, but in a highly volatile market like Crypto, it might need more confirmation before acting.
Traders often use candle stick chart pattern pdf guides to quickly check these patterns and make decisions. The more you know about these types of candlesticks, the better you’ll be at spotting opportunities and risks in the market.
Learning about these candlestick trading patterns can help traders understand how the market might move. Whether you are looking at a bullish hammer, a piercing pattern, or an evening star, each pattern tells you something about whether buyers or sellers are in control. With practice, knowing these stock market candlestick patterns will help you feel more confident in your trading choices and improve your ability to predict changes in the market.
Advanced Techniques for Reading Candlestick Charts
Candlestick charts are great tools for understanding market trends in things like stocks, crypto, forex, and commodities. The goal for traders is to make money, and they can do this by learning how to read price changes and understand market behavior. To make good trading decisions, traders need to use advanced techniques to read several candlestick patterns together. Here are some strategies to help you understand candlestick charts better.
How to Read Multiple Candlesticks Together?
Reading multiple candlestick patterns at once gives a bigger picture of what is happening in the market. This means looking for continuation patterns and reversal patterns:
- Continuation Patterns: These patterns show that the current trend will keep going in the same direction. For example, if you see multiple bullish candlestick patterns like a series of hammer candlesticks or bullish engulfing candles during an uptrend, it usually means the market will keep going up.
- Reversal Patterns: These patterns show that the trend might change direction. A morning star pattern or an evening star pattern often means a trend reversal is coming. For example, if a shooting star candle appears at the top of an uptrend, it means sellers are starting to take control, which could lead to a price drop. In a recent example of UKBRENT, a 30-minute chart showed an evening star pattern that hinted at a bearish move, but a daily chart showed a bullish flag, signaling a possible upward move. This shows how reading multiple candlesticks together can give different signals depending on the timeframe.
Volume Analysis Combined with Candlesticks
Using volume data with candlestick chart patterns gives a clearer picture of what is happening in the market. If you see a hammer candlestick pattern with high trading volume, it often means that buyers are stepping in, making a reversal more likely. The volume helps confirm if a bullish engulfing or bearish engulfing pattern is real. This is important because volume can show if a pattern is strong or if it’s just a temporary move.
Multiple Time Frame Analysis
When looking at a candlestick chart, it’s important to think about the timeframes of the candles. Short-term timeframes like 1-minute or 30-minute charts can be more affected by small market changes, while longer timeframes like daily or weekly charts are more stable. If you see a doji candlestick on both a daily and weekly chart, it makes the signal stronger. In the UKBRENT example, a 30-minute chart showed a possible bearish reversal, but the daily chart showed a bullish flag that predicted a price increase. Looking at different timeframes helps traders make more accurate decisions.
Comparing Crypto vs. Traditional Stocks
Crypto markets and traditional stock markets can show different results when reading candlestick charts. Crypto markets are very volatile, meaning that patterns like shooting star candlesticks or bullish engulfing need more caution since price changes are often unpredictable. In traditional stock markets, which are more stable, patterns like the hammer are usually more reliable. For example, an inverted hammer candlestick in a crypto market may need extra confirmation, but the same pattern in a stock market could be a strong signal for a reversal.
Understanding the Psychology Behind Candlestick Formations
Every candlestick pattern shows what buyers and sellers are thinking. A long wick in a doji candle shows indecision meaning neither buyers nor sellers are fully in control. This happens because the price was pushed in one direction, but then brought back, showing uncertainty. This often means the market is unsure, and traders may wait for more signals before acting. A hammer candlestick with a long lower wick shows that sellers tried to push the price down, but buyers fought back, which could mean a possible upward reversal. Doji candlesticks, like the Gravestone and Dragonfly, often show up in overbought or oversold markets and act as signals that a reversal may happen soon.
Using Other Indicators with Candlestick Charts
Candlestick analysis works best when combined with other indicators. Traders often ask, “What other indicators can I use along with candlestick charts?” Indicators like RSI (Relative Strength Index), MACD (Moving Average Convergence Divergence), and Volume can give you more information and help confirm what the candlestick patterns are showing. For instance, if you see a bullish engulfing pattern and the RSI is showing that the market is oversold, the chances of the price going up are stronger. Using other indicators helps traders make better decisions because they have more proof to rely on.
These are the Techniques to Improve Skills
- Complex Patterns: Learn to recognize advanced patterns like the Kicker (sharp reversals) and Tower Top/Bottom (gradual trend reversals).
- Volume Analysis: Use volume data along with candle chart patterns to confirm buying or selling pressure.
- Multiple Time Frames: Look at daily, weekly, and monthly charts to confirm patterns.
- Ichimoku System: Use Ichimoku indicators to get a full view of trends, momentum, and support/resistance.
- Statistical Validation: Know how reliable each pattern is. For example, bullish engulfing patterns often lead to reversals.
- Real-Time Practice: Practice looking at live market data to get better at recognizing patterns and making smart trading choices.
By using these advanced techniques, you can better understand candlestick charts and make smarter trading decisions. The key is to practice often, use multiple tools, and always work on improving your skills to become a better trader.
Common Mistakes When Reading Candlesticks
When learning to read candlestick patterns, there are some common mistakes you should avoid. Here are some important things to remember:
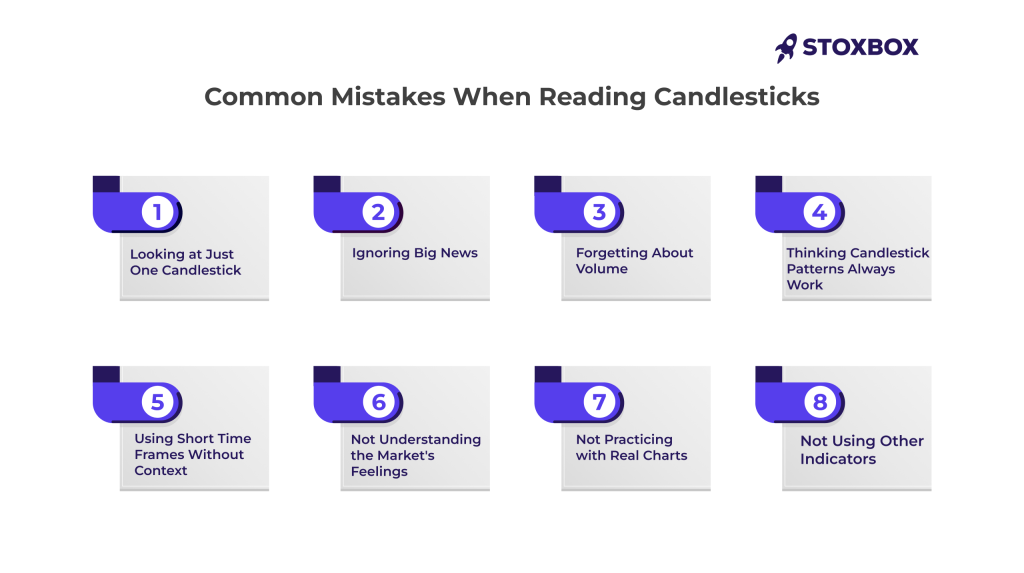
Looking at Just One Candlestick
- Don’t just focus on one candlestick without looking at the bigger picture.
- A hammer candlestick or a doji candle might seem important, but if you don’t look at the overall trend, you could make the wrong decision.
- Always look at the overall trend before deciding. For example, a bullish hammer might not mean much if the market is going down.
Ignoring Big News
- News and events like earnings reports or big economic announcements can make prices change a lot, which makes candlestick patterns less reliable.
- Even if a shooting star candle or a morning star pattern looks like a clear signal, ignoring important news could lead to mistakes.
- It’s important to know how candlestick patterns fit into what’s happening in the world.
Forgetting About Volume
- Volume is important to confirm candlestick patterns. Patterns like bullish engulfing are stronger when there is high volume.
- If there is low volume, a hammer might not be as strong as it looks.
Thinking Candlestick Patterns Always Work
- Candlestick patterns are helpful, but they are not always correct.
- Patterns like the evening star or inverted hammer give clues, but they are not guaranteed.
- Always use other indicators like MACD or RSI along with candlestick patterns to make better decisions.
Using Short Time Frames Without Context
- Beginners sometimes use short time frames, like 1-minute charts, without realizing they are very noisy.
- A doji candle on a 1-minute chart might not be meaningful if the daily chart says something different.
- Look at multiple time frames to understand what is really going on.
Not Understanding the Market's Feelings
- Each candlestick pattern shows the feelings of buyers and sellers.
- A long wick in a doji candle often means the market is confused nobody is in control. Ignoring this can lead to mistakes.
- Understanding the meaning behind patterns like bullish engulfing or inverted hammer will help you make better choices.
Not Practicing with Real Charts
- Don’t just learn candlestick patterns in theory practice with real charts.
- Patterns like the shooting star should be studied with real market data to understand how they really work.
- Practice with real-time charts to get better at spotting candlestick patterns.
Not Using Other Indicators
- Candlestick analysis alone isn’t enough. Use other indicators like RSI, Volume, and MACD for a better view.
- For example, an inverted hammer might look like a good signal, but if the RSI says the market is overbought, you should be careful.
Avoiding these mistakes will help you understand candlestick patterns better and make good trading decisions. Always look at the bigger trend, consider the news, use volume to confirm signals, and practice with real charts. This will help you become more confident and successful as a trader.
Real-World Case Study: Reading Candlestick Charts in Action
Candlestick charts are a great way to understand stock market movements. Let’s look at two real examples Tesla in the U.S. and Reliance Industries in India to see how candlestick analysis could help predict price changes and make better trading decisions.
| Company | Scenario Description | Candlestick Patterns Observed | Outcome |
| Tesla (U.S.) | In late 2023, Tesla’s stock went through big price changes because its earnings report did not meet expectations. | Evening star pattern and bearish engulfing pattern showed possible reversal after the uptrend. | Traders who saw the patterns avoided buying before the price dropped, potentially saving from losses. |
| Reliance (India) | In early 2024, Reliance saw major price swings after an important acquisition announcement. | Morning star pattern followed by a bullish engulfing pattern, indicating strong buying interest. | Traders who recognized the patterns could have bought shares and profited from the price increase. |
Candlestick Charts vs. Other Chart Types
Candlestick charts are one of the tools traders use to understand how the market is moving. Let’s compare candlestick charts with two other popular types line charts and OHLC bar charts to help you decide which one might work best for you.
Chart Type | Description | Strengths | Weaknesses |
Candlestick Charts | Shows open, close, high, and low prices for a time period. | Gives detailed information about how buyers and sellers feel, and helps spot trends and reversals. | Can be confusing for beginners because there’s a lot of information to look at. |
Line Charts | Connects the closing prices over time. | Simple and easy to understand, good for getting a quick idea of the price trend. | Doesn’t show details like high, low, or open prices—only shows the closing prices. |
OHLC Bar Charts | Shows open, high, low, and close prices as bars. | Like candlestick charts but makes it easier to see specific price points, useful for technical analysis. | Not as visual as candlestick charts, making it harder to spot patterns or market sentiment easily. |
Frequently Asked Questions
What is the difference between a bullish and a bearish candle?
A bullish candle shows that the price went up during that time period. It usually appears green or white. A bearish candle means the price went down, and it’s usually red or black. The color helps you see right away if the market was going up or down.
How do candlestick charts help predict future trends?
Candlestick charts show price movements in a visual way, helping traders spot patterns that often repeat. When traders see certain patterns, like a morning star or shooting star, they can guess if the price will go up or down next, making it easier to decide when to buy or sell.
Can I use candlestick charts even if I’m a beginner?
Yes, beginners can use candlestick charts, but it might take some practice to understand all the details. Start by learning the basic patterns, like the hammer and doji, to get a feel for how prices move.
What does it mean if there is a long wick on a candlestick?
A long wick means there was a lot of movement, but the price didn’t stay at those extreme points. It shows that there was a fight between buyers and sellers, but neither side fully won. Long wicks often mean uncertainty or a possible reversal.
Should I only use candlestick charts to make trading decisions?
It’s best not to rely only on candlestick charts. They are a great tool, but they work better when you combine them with other indicators like RSI (Relative Strength Index) or MACD (Moving Average Convergence Divergence). This way, you get a more complete picture of the market.
What do I do if the market doesn’t follow the candlestick pattern I expected?
Sometimes the market doesn’t move as the candlestick pattern suggests, because of unexpected news or other factors. If this happens, it’s important to have a plan, like setting a stop-loss to limit potential losses. Remember, no pattern is 100% correct every time.
How do I avoid making mistakes when using candlestick charts?
To avoid mistakes, always look at the bigger trend instead of just one candle pattern. Also, be aware of news events that could affect the market, and use other tools, like volume indicators, to confirm what the candlestick is telling you. Practice makes perfect, so use demo accounts to get comfortable before trading with real money.
You might also Like.
Double Top Pattern: The Ultimate Trading Guide
Have you ever witnessed a promising uptrend reverse on you...


