
Table of Contents
Investors should be highly dependent on equity research while deciding whether to buy or sell stocks. How is it done? It usually involves a detailed study and analysis of various companies regarding their financial health, performance in the market, and overall economic indicators. This skill is especially important in India, where the stock market is full of potential opportunities and potential risks.
Understanding Equity Research
At its very core, equity research helps investors understand the potential performance of stocks. The entire process is usually done by analyzing economic, sectoral, and company-specific factors. In the Indian context, this means that the analysts will not only be updated about global economic indicators but also about domestic events. This includes anything that may impact market trends—changes in government policies, economic reforms, and the regulatory environment.
Key Tools and Techniques in Equity Research
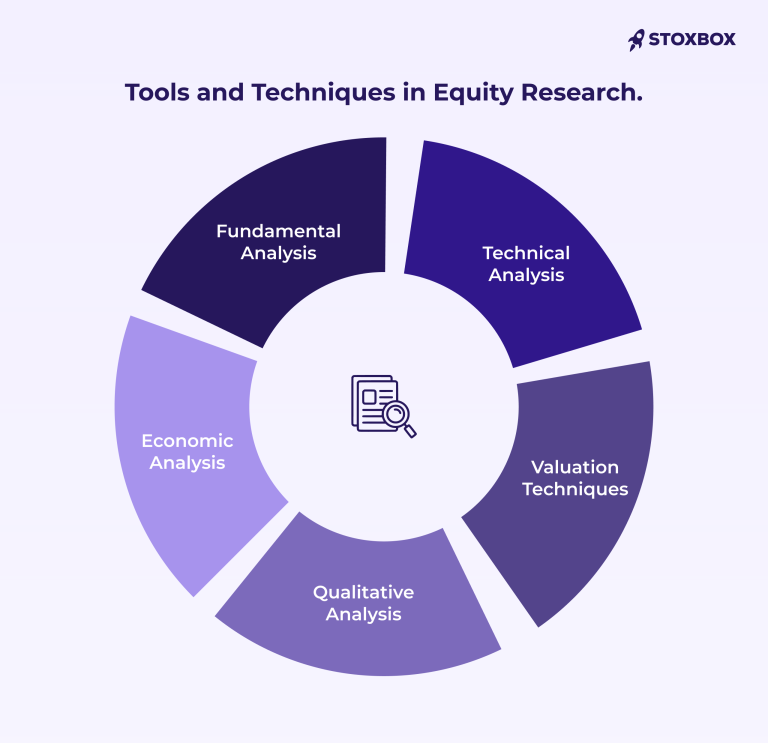
Fundamental Analysis
Equity research is incomplete without fundamental analysis. What does that entail? It includes looking at the financial statements of the company, how they are positioned in the market, competitive advantages, their growth prospects, everything. Investors also look at many other metrics, such as earnings, revenues, expenses, assets, and liabilities.
- Financial Statements: The financial statements of a company include the cash flow statement, income statement, and balance sheet. Analysts look at this to start with their fundamental analysis. They also get an idea about how the company is performing financially by looking at its cash reserves, profitability, degree of debt, and revenue streams.
- Evaluating Market Position: It takes into account the status of the organization among the competitors in the same line of business. The analysts take into view market share, scalability in business models, and the exposure of a firm to various market conditions. Take a company dealing in India’s highly competitive telecom industry, for example. It may be rated on the basis of its market position by growth in its subscriber base and diverse offerings.
- Analyzing Competitive Advantages: What differentiates a company from its competitors today? It’s mostly exclusive technology, brand equity, regulatory approvals, and cost advantages. A pharmaceutical company with a patented medicine, for example, might have a competitive advantage.
- Prospect for Future Growth: Analysts project the company’s future performance based on current and historical data. The projection also looks into a company’s strategy to grow, industry trends, as well as the general economic state. In India, analysts can get an insight into a company’s future growth by considering their alignment with governmental initiatives like ‘Make in India’.
- Risk Assessment: No investment is devoid of risk. Fundamental analysis, therefore, needs to identify those risks. It could be sector-specific, regulatory, or market-related. As an example, changes in regulatory policies concerning the Indian financial sector, such as in non-performing asset recognition or capital adequacy norms, would have to be factored in.
- Example: In the case of an Indian IT company, an analyst could consider revenue from various geographies, customer acquisition rates, and expenses incurred on R&D. For instance, studying the annual reports of TCS for its profitability and comparing it with Infosys or Wipro will give more valuable insights into its market standing.
Technical Analysis
This technique involves studying historical market data and stock price movements to predict future behaviour. Technical analysts in India have greatly used charts to track patterns and trends, based on which they make their decisions related to short-term trading.
- Chart Analysis: This usually involves charts and examining stock price movements and volume data over time. Analysts make use of different chart types like line, bar, and candlestick charts to uncover patterns and trends that show indications of future movements. These charts are quite vital in India for making informed decisions on time since market sentiments keep on changing with new economic reports and alteration of policies.
- Identifying Support and Resistance Levels: The level of support can be referred to as the price level from which a stock consistently stops falling. This usually means that buying interest is strong enough to absorb the selling pressure. Resistance, on the other hand, can be considered the level at which the selling pressure becomes stronger than the buying pressure, preventing the price from further increasing. These levels provide traders with clues on entry and exit points.
- Using Technical Indicators: Some of the technical indicators that analysts use are moving averages, Relative Strength Index (RSI), and Moving Average Convergence Divergence (MACD). These help them predict future price movements. For example, moving averages help identify the direction in price trends; RSI can be considered to find out whether a particular stock is overbought or oversold.
- Pattern Recognition: Specific patterns in price charts have predictive value. The common patterns are ‘head and shoulders’, ‘double top and bottom’, and ‘triangles’. These help predict the continuation of a trend or its opposite, which is very useful in the highly volatile Indian stock market.
- Volume Analysis: Volume is essential for determining how strong a price trend is. An uptrend with higher volume tends to be bullish, while a downtrend with high volume support is considered to show strong selling pressure. In technical analysis, the volume is treated to represent the robustness of price, trends, and how likely they are to sustain.
- Example: Charting of price movements of Reliance Industries Limited (RIL) shares for the last six months can outline support and resistance levels that can predict future price movements.
Economic Analysis
This type of analysis involves understanding the various economic variables that would impact the stock market, like the rate of growth of GDP, rate of inflation, unemployment rate, and monetary policy pursued by the RBI.
- GDP Growth Rates: High GDP in India means there is economic growth. This may result in higher corporate earnings and hence, higher prices of stocks. If the growth rates of GDP start slowing down, then it would imply a slowing economy that may lead to lesser profits for companies and hence, lower prices of stocks.
- Inflation Data: Stock market performance is influenced by inflation. During periods of high inflation, the values of future cash flows diminish, thereby keeping the valuations of stocks low. On the flip side, moderate inflation may also reflect the growth of an economy. In India, inflation can change widely basis fuel prices and food costs. By knowing such trends, one will be able to assess the changes in monetary policy of the RBI and its impacts on the stock market.
- Unemployment Rates: High unemployment usually means bad news for the economy. Consumer expenditure also gets hit, leading to poor corporate earnings. Equity researchers in India can get an idea about consumer confidence and spending by examining employment trends. This is directly related to corporate earnings and stock performance.
- Monetary Policies of the Reserve Bank of India (RBI): The market is highly influenced by monetary policies related to interest rates and liquidity adjustments. When interest rates are low, the cost of capital is low, so more borrowing and investment can take place. Hence, the stock market may record an upward trend. Contrarily, when interest rates are high, this may dampen investment spending, though it does stabilize inflation.
- Fiscal Policies and Government Spending: These further guide economic activity and investor sentiments. Huge projects of infrastructure or subsidies towards certain sectors may help to raise stock performance. Budget announcements and fiscal policies are followed by equity researchers to assess which sectors would benefit or get hurt due to the decisions of the government. This turns out to be even more relevant in a country like India, where the effect of government initiatives is seen on the markets.
For instance, an analyst would look at indicators like RBI interest rates and auto sales numbers nationally before investing in cyclical stocks, such as those in the auto sector.
Qualitative Analysis
This involves the analysis of information relating to the firm that is not quantifiable. Factors such as quality of management, brand strength, and corporate governance top the list.
- Management Quality: The ability and integrity of a firm’s management are important in the success of the company. High-quality leaders who have navigated the economic cycle, changed market conditions, and made strategic decisions have immense value. In India, family-run businesses are very common. The succession of leadership along with changes in management style greatly affect the growth and sustainability of such firms.
- Brand Strength: Strong branding can help a firm achieve some key competitive advantages that will contribute to pricing power and customer loyalty. These are essential for long-term profitability in every market, including the dynamic Indian market, where consumer preferences can shift very fast. With a robust brand, a company could successfully resist other firms competing in both home and international markets.
- Corporate Governance: Good corporate governance correlates strongly with improved trust and investment levels. Companies with open and transparent, accountable governance structures are safe investments. Issues of governance have always dented the reputations of firms in India and inflated or deflated their stock prices. The adherence to regulatory standards, the composition of the board, and the presence of independent directors are closely scrutinised.
- Industry Position and Competitive Advantage: Understanding where a company stands in context of its competitors helps assess its potential for market leadership and durability. In a country like India, companies that are best in technology, innovation, customer service, or cost-efficient practices attain regular growth.
- Research and Development (R&D) and Innovation: What does it take for industries to grow today? It’s usually innovation—and this is especially true for industries such as technology, pharmaceuticals, and automobiles. And R&D-focused businesses are likely to be prepared to stay ahead of emerging laws, consumer demands, and technology changes.
For instance, assessing the governance and leadership of Tata Group companies can provide some insight into ethical and long-term sustainability issues.
Valuation Techniques
Valuation is the cornerstone of equity research. Precedent transaction, comparable company analysis, and DCF analysis are the techniques followed in the Indian market at present.
For instance, an analyst could use DCF to forecast the future cash flows of the fast-growing Indian startup and estimate its present value, while also accounting for the market’s growth prospects and volatility.
Practical Application: A Case Study
These techniques can be better explained by taking the example of HDFC Bank. An equity researcher would first proceed with the fundamental analysis—things like quarterly earnings, interest income growth, and loan growth.
Technical analysis may involve studying the performance of the stock of HDFC Bank in different market cycles with indicators such as moving averages or MACD.
For economic analysis, the current policies of the RBI would have to be analyzed for their effect on HDFC’s operations, while qualitative analysis could look at the various decisions made by the bank’s management during economic slumps.
For valuation analysis, one can take the financial ratios of HDFC and compare them with those of other banking companies like ICICI and SBI to observe its position in the market.
Now, we can safely conclude that equity research is an art of integrating all these techniques into one in order to provide investment insights. In the rapidly changing Indian market, these observations help make sense of complex market trends and guide investment decisions. Any aspiring analyst should keep honing their skills in these areas to provide meaningful guidance to investors in the Indian stock market.
Frequently Asked Questions
What are equity research tools & why are they important?
Equity research tools are platforms or resources that help investors analyze and evaluate stocks to make informed investment decisions. They provide insights into financial performance, market trends, and growth potential.
How do equity research tools assist investors in stock selection?
These tools offer data-driven insights, such as fundamental analysis, technical charts, and peer comparisons, enabling investors to identify stocks that align with their investment goals and risk tolerance.
What are some key features to look for in an equity research tool?
Effective equity research tools should offer real-time data, detailed stock analysis, customizable watchlists, valuation metrics, and actionable recommendations to aid decision-making.
Can equity research tools predict stock performance?
While they cannot predict outcomes with certainty, these tools provide valuable insights and historical data to help investors make educated predictions about a stock’s future performance.
Are equity research tools useful for beginners?
Yes, equity research tools often come with user-friendly interfaces, tutorials, and simplified data presentations, making them accessible for novice investors looking to build their portfolios.
What are the types of analyses provided by equity research tools?
They typically offer fundamental analysis (e.g., financial statements and earnings reports), technical analysis (e.g., price trends and patterns), and sentiment analysis (e.g., market news and social sentiment).
How can equity research tools help with risk management?
By providing insights into a company’s financial health, industry trends, and market conditions, these tools allow investors to assess risks and diversify their portfolios effectively.
Your Wealth-Building Journey Starts Here